July 31, 2024
Reading time: 2 minute(s)
Creating Thiessen polygons
Reading time: 2 minute(s)
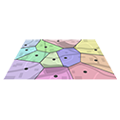
Build Thiessen polygons that define solid area around each input point, where any location inside the polygon is closer to that point than any of the other input points.
The XTools Pro Thiessen Polygons tool is provided to create polygons that define areas of influence around each input point. Thiessen polygons are the polygons generated from points or multipoints and defined by the perpendicular bisectors of the lines between all points and drawn so that each polygon bounds the region that is closer to one point than to any adjacent point.
The tool has the following capabilities:
- Specifying an extent where the output polygons are created
You draw a rectangle manually. Moreover, with an additional option the specified extent can be expanded by 10%. - Creating weighted Thiessen polygons
Weighted Thiessen polygons show input features influence on the environment closer to reality. A point with a greater weight that is taken from the attribute field has greater influence than a point with a smaller weight, and this results in creating a polygon with a larger area. This is why the borders of output polygons may be arcs. Using this tool, you can also densify arcs in the output polygons.
The Thiessen Polygons tool is ideal for defining areas of influence and proximity analysis:
- In hydrology, Thiessen polygons are used to define the area of influence around rain gauge stations. This method helps in estimating the spatial distribution of rainfall and managing water resources more effectively by understanding which areas are served by specific rain gauges.
- Urban planners can use Thiessen polygons to determine the service areas of amenities such as schools, hospitals, and fire stations. It helps in analyzing the accessibility of these services and identifying underserved areas, thereby facilitating better infrastructure planning and resource allocation.
- By weighting healthcare facilities based on attributes such as bed capacity, number of staff, or service quality, this tool can create polygons that represent more accurate catchment areas. It helps in analyzing healthcare accessibility and identifying areas that may require additional facilities or resources.
- In epidemiology, the tool can be used to model the spread of diseases by weighting cases based on severity or infection rates. It helps in understanding the spatial dynamics of disease spread and planning targeted interventions
- Businesses can use Thiessen polygons to define trade areas for retail stores based on customer locations. This analysis helps in understanding market coverage, optimizing store locations, and planning marketing strategies to reach target demographics effectively.
- Retailers can use weighted Thiessen polygons to define market areas around stores, with weights assigned based on store size, sales volume, or customer ratings. That provides a more realistic representation of each store’s market influence, helping businesses optimize locations and marketing strategies.
- By weighting customer locations based on purchasing power or frequency of visits, businesses can better understand their market penetration and identify potential areas for expansion.
